| There was no difference in averages times between high & low pressures | ||
|---|---|---|
| Air Pressure (PSI) | Average Time (s) | Distribution of times |
| High pressure: 25/58 (front/rear) | 10.81 | |
| Low pressure: 18/20 (front/rear) | 10.78 | |
Are Lower Tire Pressures Faster?
We all know the theory: lower tire pressures mean more grip, higher pressures roll faster. But when it comes to real-world speed, which one really wins? I set out to answer this with 30 timed runs down the same track.
Testing setup
The experiment
Two sets of tire pressures were chosen for my 88kg weight: 25/28 PSI (front/rear) for the higher pressures and 18/20 PSI (front/rear) for the lower pressures. These pressures maintain a consistent 0.9 front to rear ratio, with the high pressures aligning with recommendations such as those from E13.
After three warm up laps, each set of tire pressures was then tested over 15 runs, resulting in 30 total laps. The runs were performed in batches of five runs with high or low pressures selected at random and maintained for the current batch. To time the runs, an automatic Freelap timing system was used, with an accuracy of 0.02s.
The track
The upper section of Mondini Downhill, a blue flow trail in the south of Switzerland, was used for testing. It has a steep roll in followed by three flat to medium banked corners with just the right gradient that your tires begin to break traction if you don’t pedal or touch the breaks. Testing only three corners meant that I could reduce the effect that other factors such as mistakes and fitness may have had on the results.
The test rig
The test bike of choice was a Raaw Madonna v2.2. At 188cm in height, I chose a size large. The geometry of this bike feels great, with the high stack and well proportion chainstays creating intuitive handling that makes placing weight between the front and rear tires feel effortless.
Michelin Wild Enduro Racing Line tires were chosen for this test. It is a tire I have a lot of experience on and believe it is well suited for the terrain that is frequently found here in the south of Switzerland. Inside the tires was a set of Cushcore pro inserts.
The Results
Average performance
Let’s just jump straight to the answer you are probably itching to hear: on average, factoring in the accuracy of the timing system of 0.02s, there was no significant difference in performance between the higher (10.81s average) and lower (10.78s average) tire pressures.
But, there is more to the story than looking at averages. If we overlay the distribution plots for the different pressures from the table (which show how times are spread across all the runs) you may notice that there is a difference between the high and low pressures.
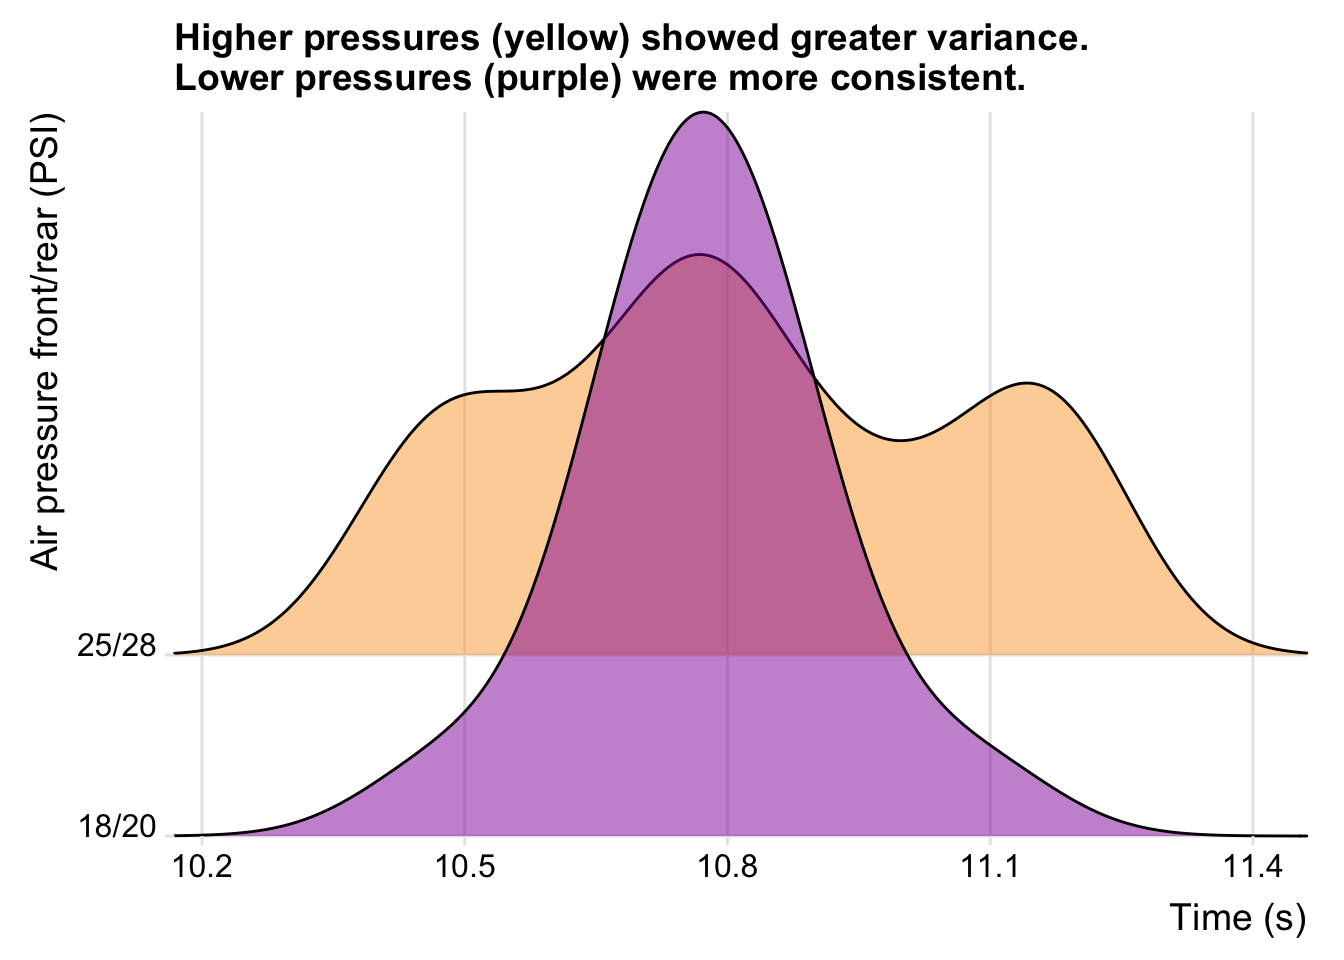
Here, we can see that the highest tire pressures produced not only the fastest results of the testing (the left tail of the yellow distribution), but also the slowest results of the testing (the right tail of the yellow distribution). The lower pressures on the other hand produced more consistent results, as seen by the tighter band of results around the 10.8 s mark in the purple distribution. Another way to visualise this is to take the five fastest and slowest runs across all tire pressures, and count how many appear in each group. Here we see that eight out of the ten fastest/slowest runs were on the higher tire pressures:
| Higher pressures produced the fastest and slowest runs | ||
|---|---|---|
| Air pressure front/rear (PSI) | Time (s) | Fastest or slowest five runs |
| 25/28 | 10.45 | Fastest |
| 25/28 | 10.45 | Fastest |
| 18/20 | 10.48 | Fastest |
| 25/28 | 10.51 | Fastest |
| 25/28 | 10.60 | Fastest |
| 25/28 | 11.18 | Slowest |
| 25/28 | 11.17 | Slowest |
| 25/28 | 11.17 | Slowest |
| 18/20 | 11.08 | Slowest |
| 25/28 | 11.06 | Slowest |
These results match my experience during the testing where I found that although the lower tire pressures rolled slower, they had more grip on offer. This made placing them precisely where I wanted easier and as a result I was more consistently able to find the line I wanted. The higher tire pressures on the other hand were more likely to slip off line, resulting in mistakes. But when the line was found, they were faster.
Learning period
Looking at averages and consistency across the whole testing period is important to do as we typically only get to ride a line once, or maybe a handful of times, during a ride or race. So understanding how the tires perform from the first to the last effort is important. But, for most of us (myself included), there is a learning period as we ride a track on repeat. To see this learning period during this test, let’s plot the time of each run over the course of testing:
We can see that on average the times got faster as the testing progressed and then plateaued and became more consistent towards the end of the session. This learning period is probably due to the simple fact that I got better and better at the track, the more runs I did. To control for this, let’s remove the first ten runs and replot our distributions of times:
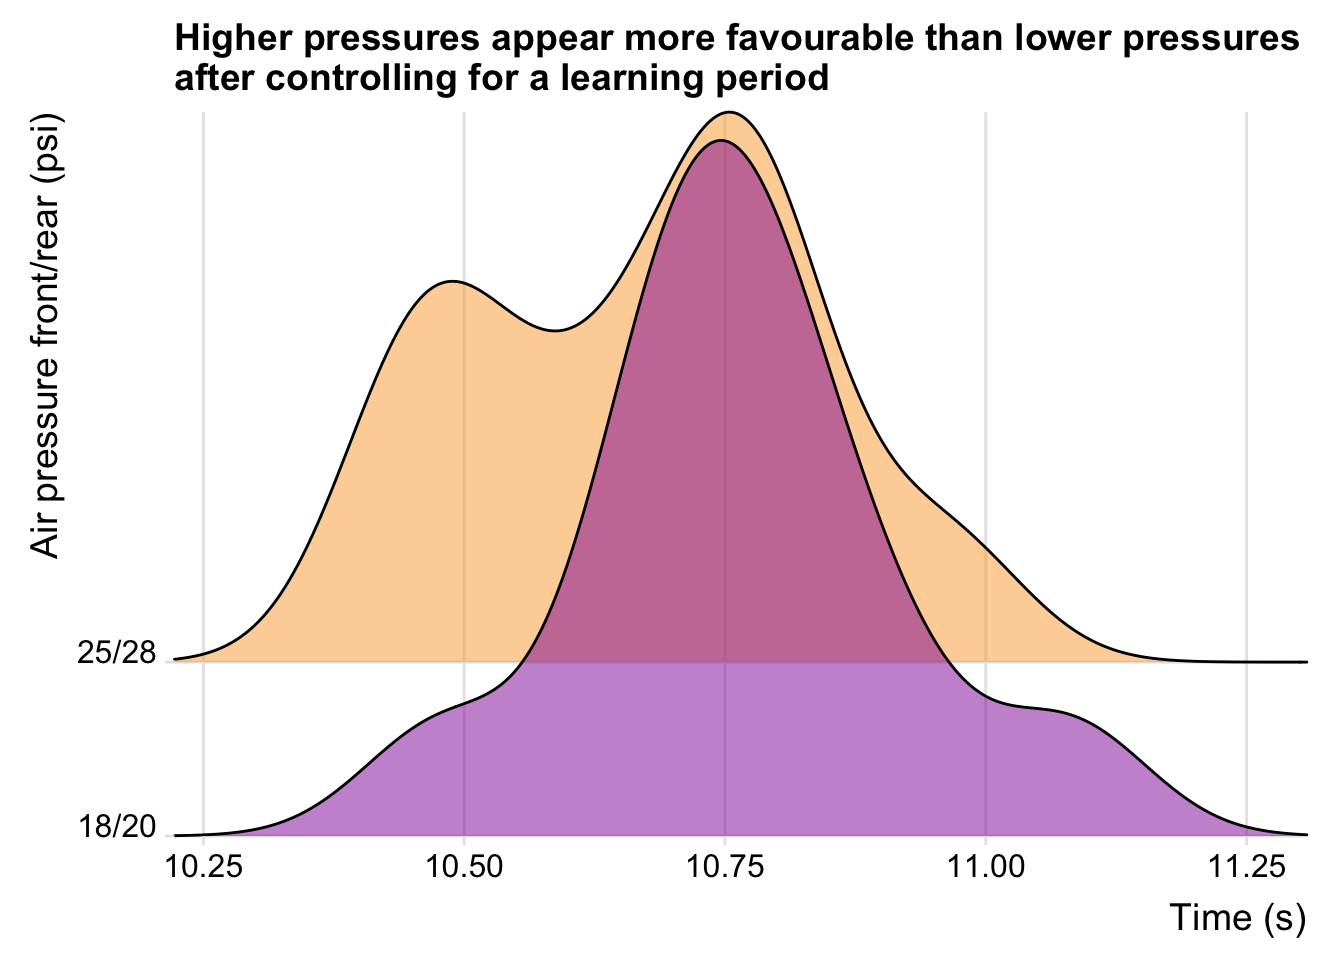
The story changes! Like before, the lower tire pressure still prove to be more consistent as shown by the tight band of the purple distribution. But unlike before, a higher number of faster laps, and a lower number of slower laps were observed for the higher pressures. I interpret this to mean that once you have a mastered a track, the improved rolling speed of the higher pressures becomes advantageous.
Takeaways?
My take away from this testing is that slower tire pressures offer the advantage of consistency. For the casual racer or weekend warrior, I think this should be an important consideration. Because unless you are Loic Bruni and can hit the perfect line, first time, every time, you often don’t have the luxury to hit the same section of track 30 times to find the perfect line. If you do, then great! Rock the higher tire pressures, as there seems to be an advantage in speed.
But, take these insights with a pinch of salt. They are specific to the combination of tires, rider, track and conditions. Would the results repeat on a wet day down Val di Sole? Possibly. Possibly not. For that, we need more testing. For now, think about how you might use these results to better tune your bike for your next ride.
The code and data are open source and can be accessed here.